Visualizing npm package dependencies with Sprotty
 Dr. Miro Spönemann
Sprotty is an open-source diagramming framework that is based on web technologies. I’m excited to announce that it will soon be moved to the Eclipse Foundation. This step will enable existing visualizations built on the Eclipse Platform to be migrated to cloud IDEs such as Eclipse Theia. But Sprotty is not limited to IDE integrations; it can be embedded in any web page simply by consuming its npm package. In this post I present an application that I implemented with Sprotty: visualizing the dependencies of npm packages as a graph. Of course there are already several solutions for this, but I was not satisfied with their graph layout quality and their filtering capabilities. These are areas where Sprotty can excel.
Standalone web page
The application is available at npm-dependencies.com. Its source code is on GitHub.
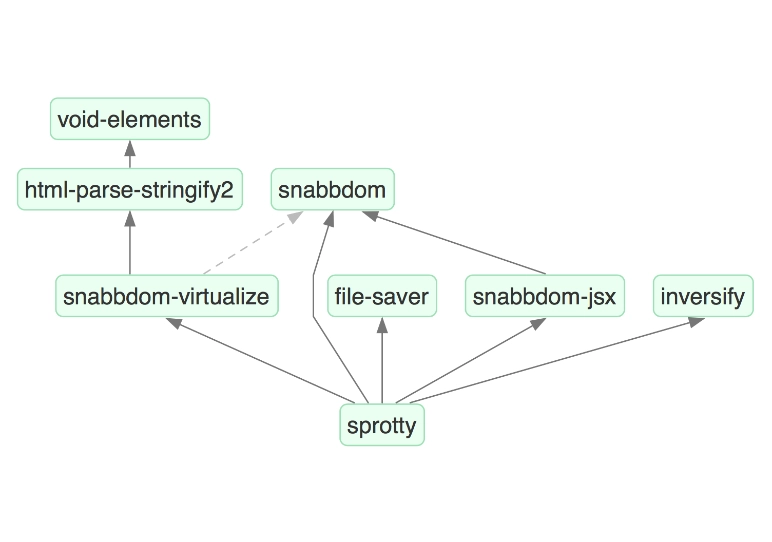
The web page offers a search box for npm packages, with package name proposals provided through search requests to the npm registry. After selecting a package, its metadata is resolved through that same registry and the direct dependencies are shown in the diagram. Further dependencies are loaded by clicking on one of the yet unresolved packages (shown in light blue). If you want to see the whole dependency graph at once, click the “Resolve All” button. For projects with many transitive dependencies, this can take quite some time because the application needs to load the metadata of every package in the dependency graph from the npm registry. The resulting graph can be intimidatingly large, as seen below for lerna.
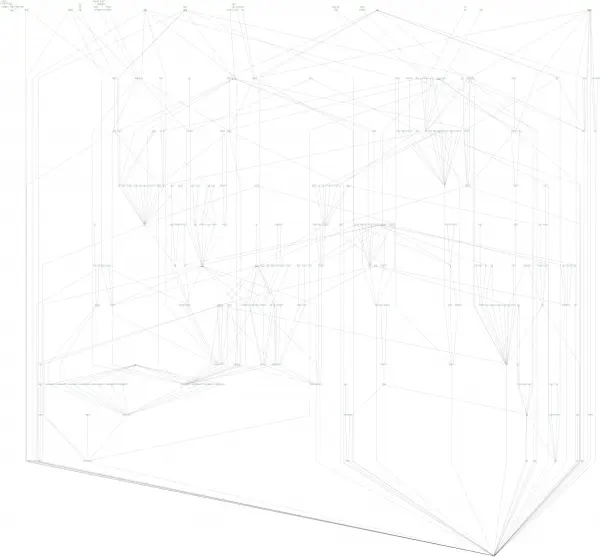
This is where filtering becomes indispensable.
Let’s say we’re only interested in the package meow and how lerna depends from it. Enter meow in the filter box and you’ll see this result:
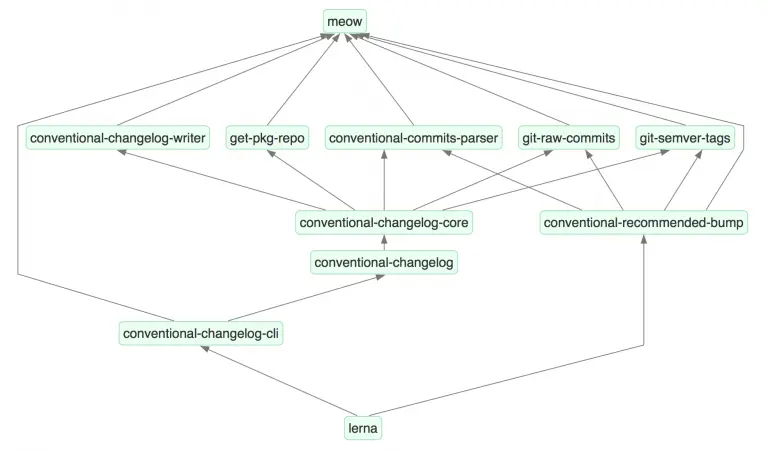
The filtered graph shows the packages that contain the filter string plus all packages that have these as direct or indirect dependencies. Thus we obtain a compact visualization of all dependency paths from lerna to meow.
Hint: If the filter text starts with a space, only packages that have the following text as prefix are selected.
If it ends with a space, packages must have the text as suffix.
Thus, if the text starts and ends with a space, only exact matches are accepted.
How it works
The basic configuration of the diagram is quite simple and follows the concepts described in the documentation of Sprotty. Some additional code is necessary to resolve package metadata from the npm registry and to analyze the graph to apply the selected filter. A subclass of LocalModelSource serves as the main API to interact with the graph. Automatic layout is provided by elkjs, a JavaScript version of the Eclipse Layout Kernel. Here it is configured such that dependency edges point upwards using the Layered algorithm. It tries to minimize the number of crossings, though only through a heuristic because that goal cannot be satisfied efficiently (it’s an NP-hard problem).
Integration in Theia
The depgraph-navigator package can be used in a standalone scenario as described above, but it also works as an extension for the Theia IDE.
Once installed in the Theia frontend, you can use this extension by right-clicking the package.json file of an npm package you are working on and selecting Open With → Dependency Graph.
If you have already installed the dependencies of your project via npm install or yarn, all package metadata are available locally, so they are read from the file system instead of querying the npm registry.
The registry is used only as a fallback in case a package is not installed in the local project.
This means that resolving further packages is much faster compared to the standalone web page.
You can get a full graph view of all dependencies by typing ctrl + shift + A (cmd + shift + A on Mac).
Again, if the number of dependencies is too large, you probably want to filter the graph; simply start typing a package name to set up the same kind of filter described above for the standalone application (press esc to remove the filter).
Try it!
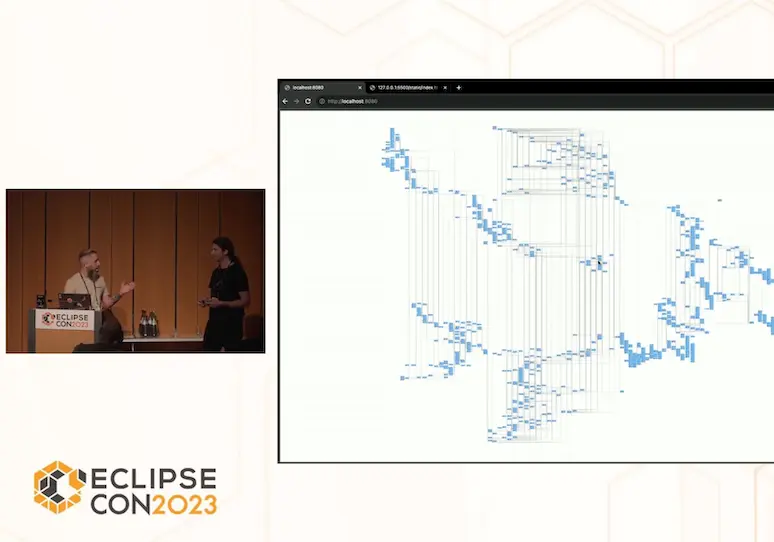
If you haven’t already done it while reading, try the dependency graph application. You are welcome to get in touch with me if you have any questions about Sprotty and how it can help you to build web-based diagrams and visualizations. By the way, don’t miss the talk on Sprotty at EclipseCon France that I will do together with Jan next week!
About the Author
Dr. Miro Spönemann
Miro joined TypeFox as a software engineer right after the company was established. Five years later he stepped up as a co-leader and is now eager to shape the future direction and strategy. Miro earned a PhD (Dr.-Ing.) at the University of Kiel and is constantly pursuing innovation about engineering tools.