Code generation for Langium-based DSLs (3/3)
 Christian Schneider
This includes navigating generated artifacts and their corresponding sources within an IDE, e.g., for manual review, as well as automatically switching to the DSL-based sources while debugging the generated code. In order to enable such features in a DSL-based dev tool, the code generator needs to collect data on what has been generated because of which source definition. In this post I show you how we extended Langium’s code generator API to capture such information. And I will give you a quick presentation of minimal DSL tool that runs entirely in the browser, and that generates code being interactively debuggable – within the DSL. 😎
Why?
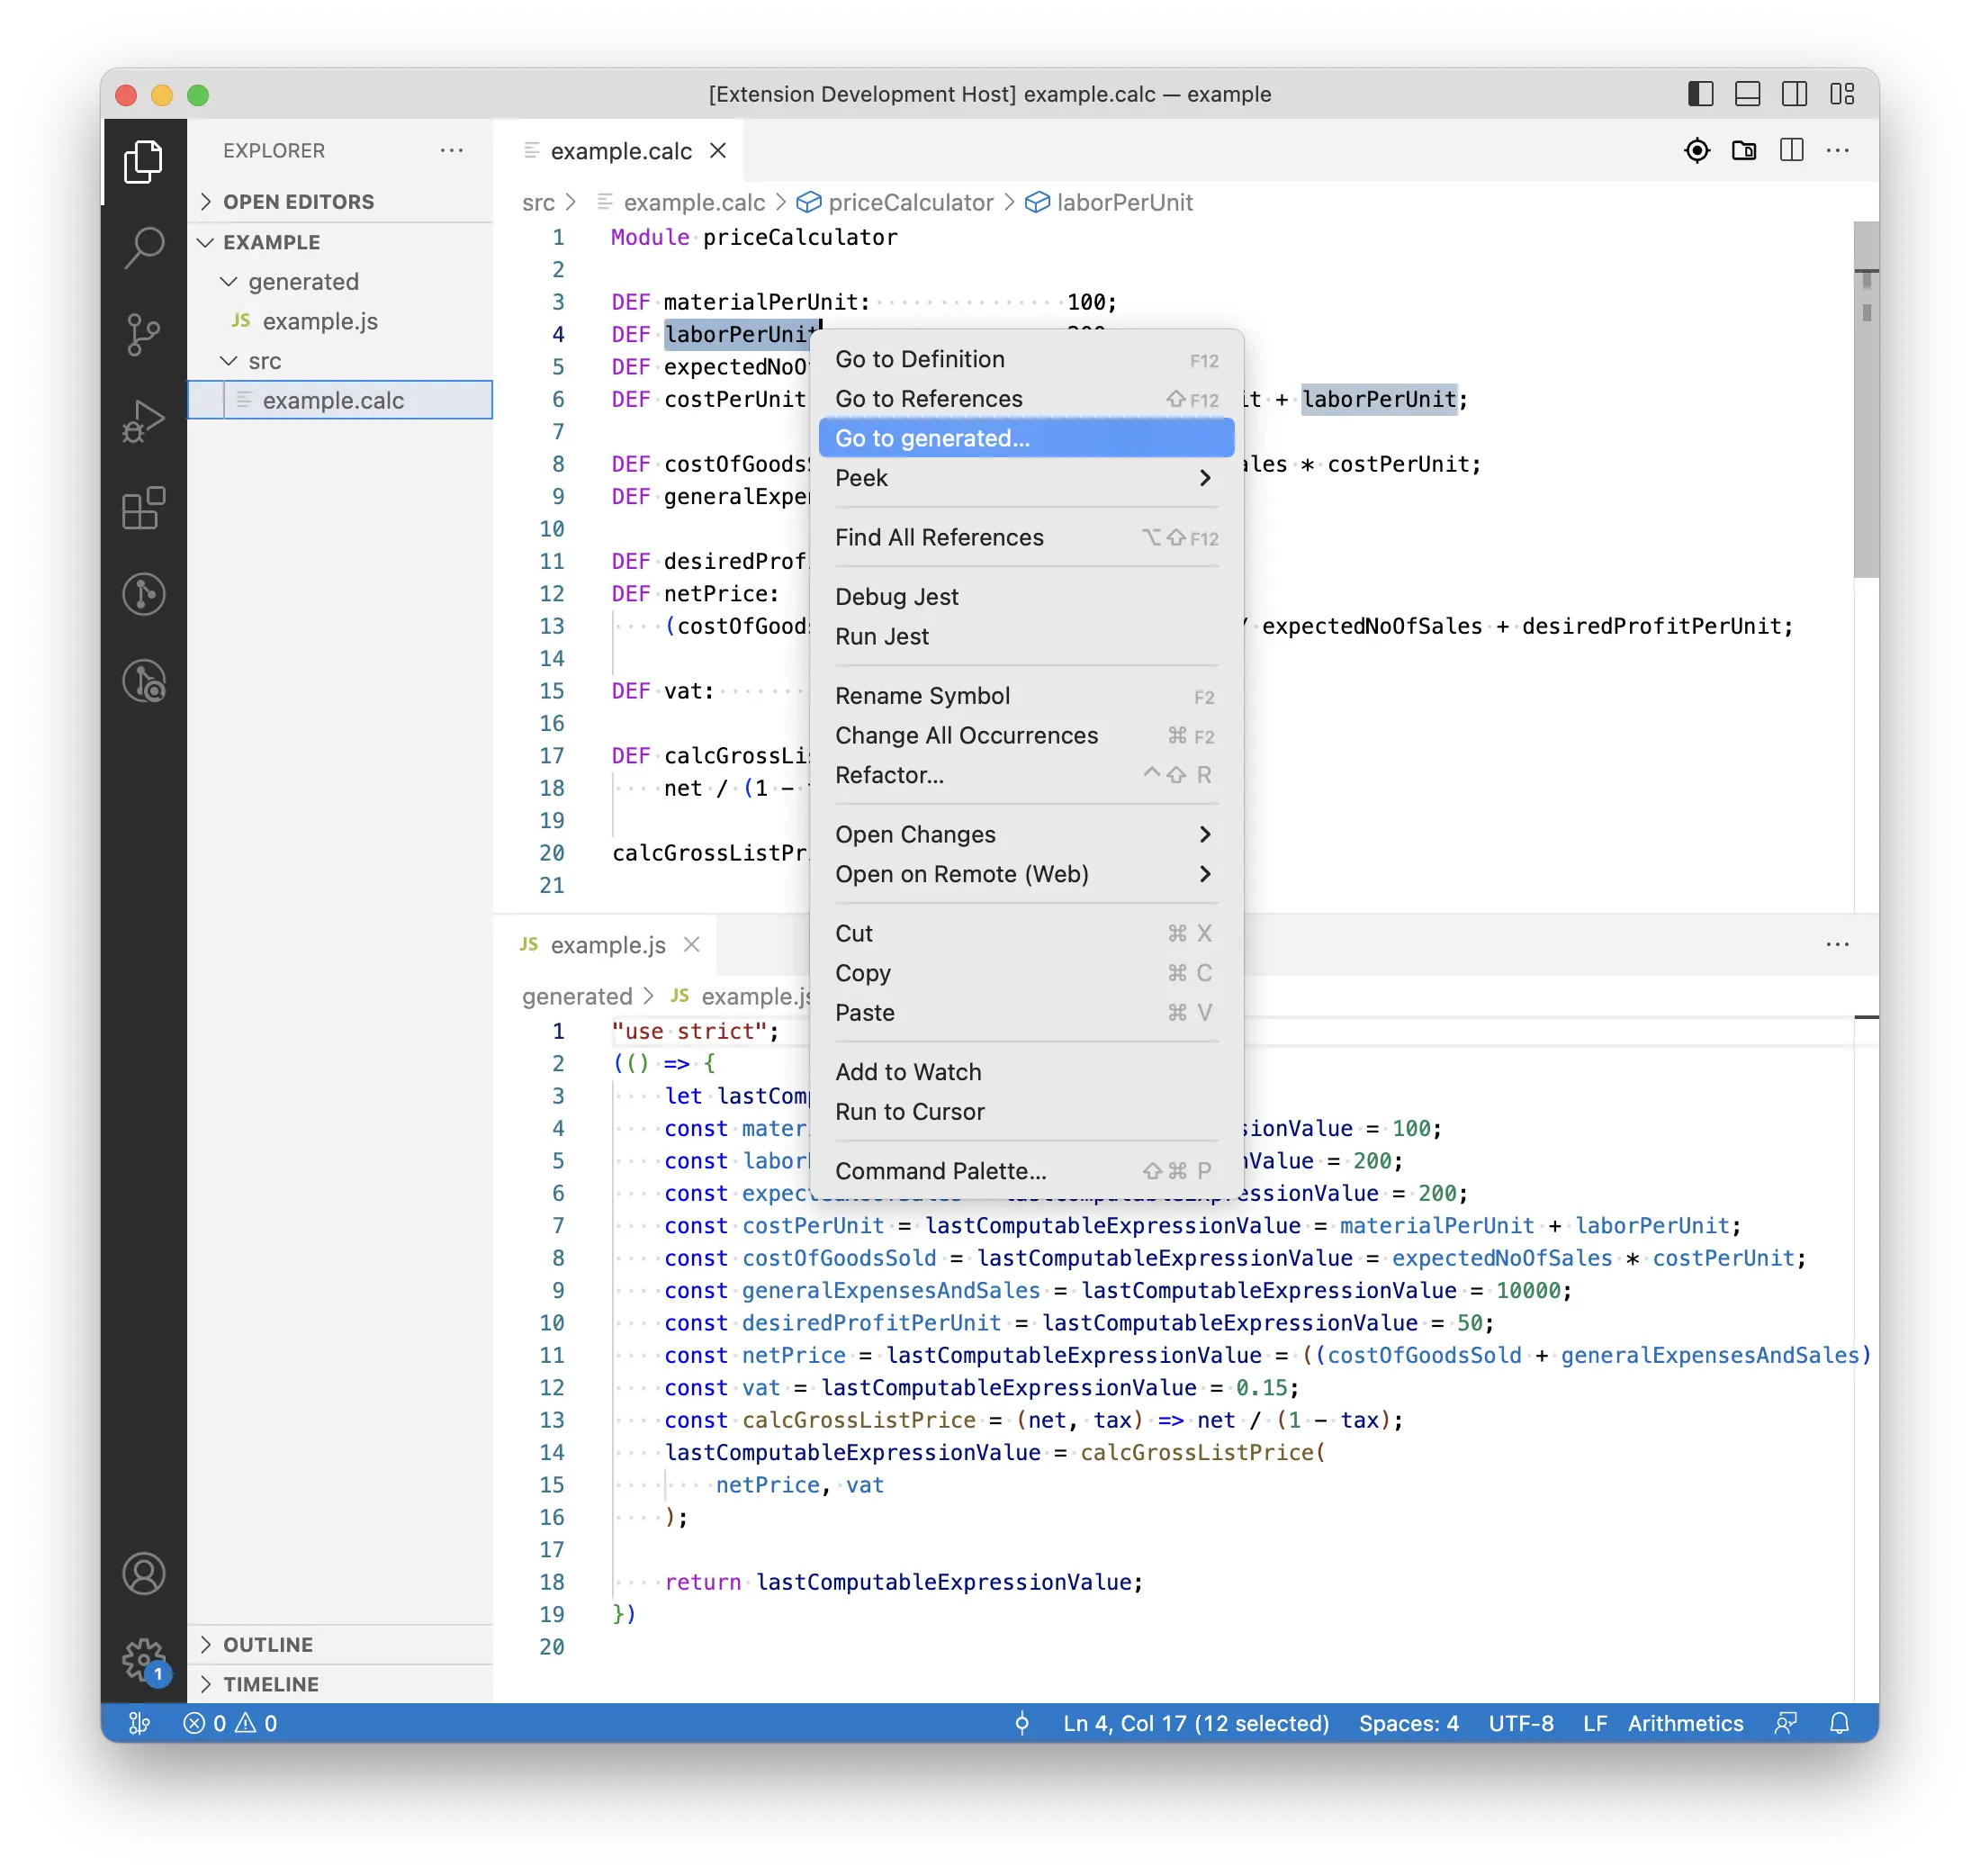
Let me start with an illustration of the navigation between DSL source and generated code back and forth with the following screenshots. Users of a DSL tool might want to understand what the code generator produces for a dedicated statement. The DSL dev tool might offer such a review tool, e.g. via a selection-sensitive context menu item, as shown in the first screenshot. (Of course, other integrations are possible, too.) To make this a little more complicated: There might be several places within the generated artifacts that are influenced by a certain statement or definition.
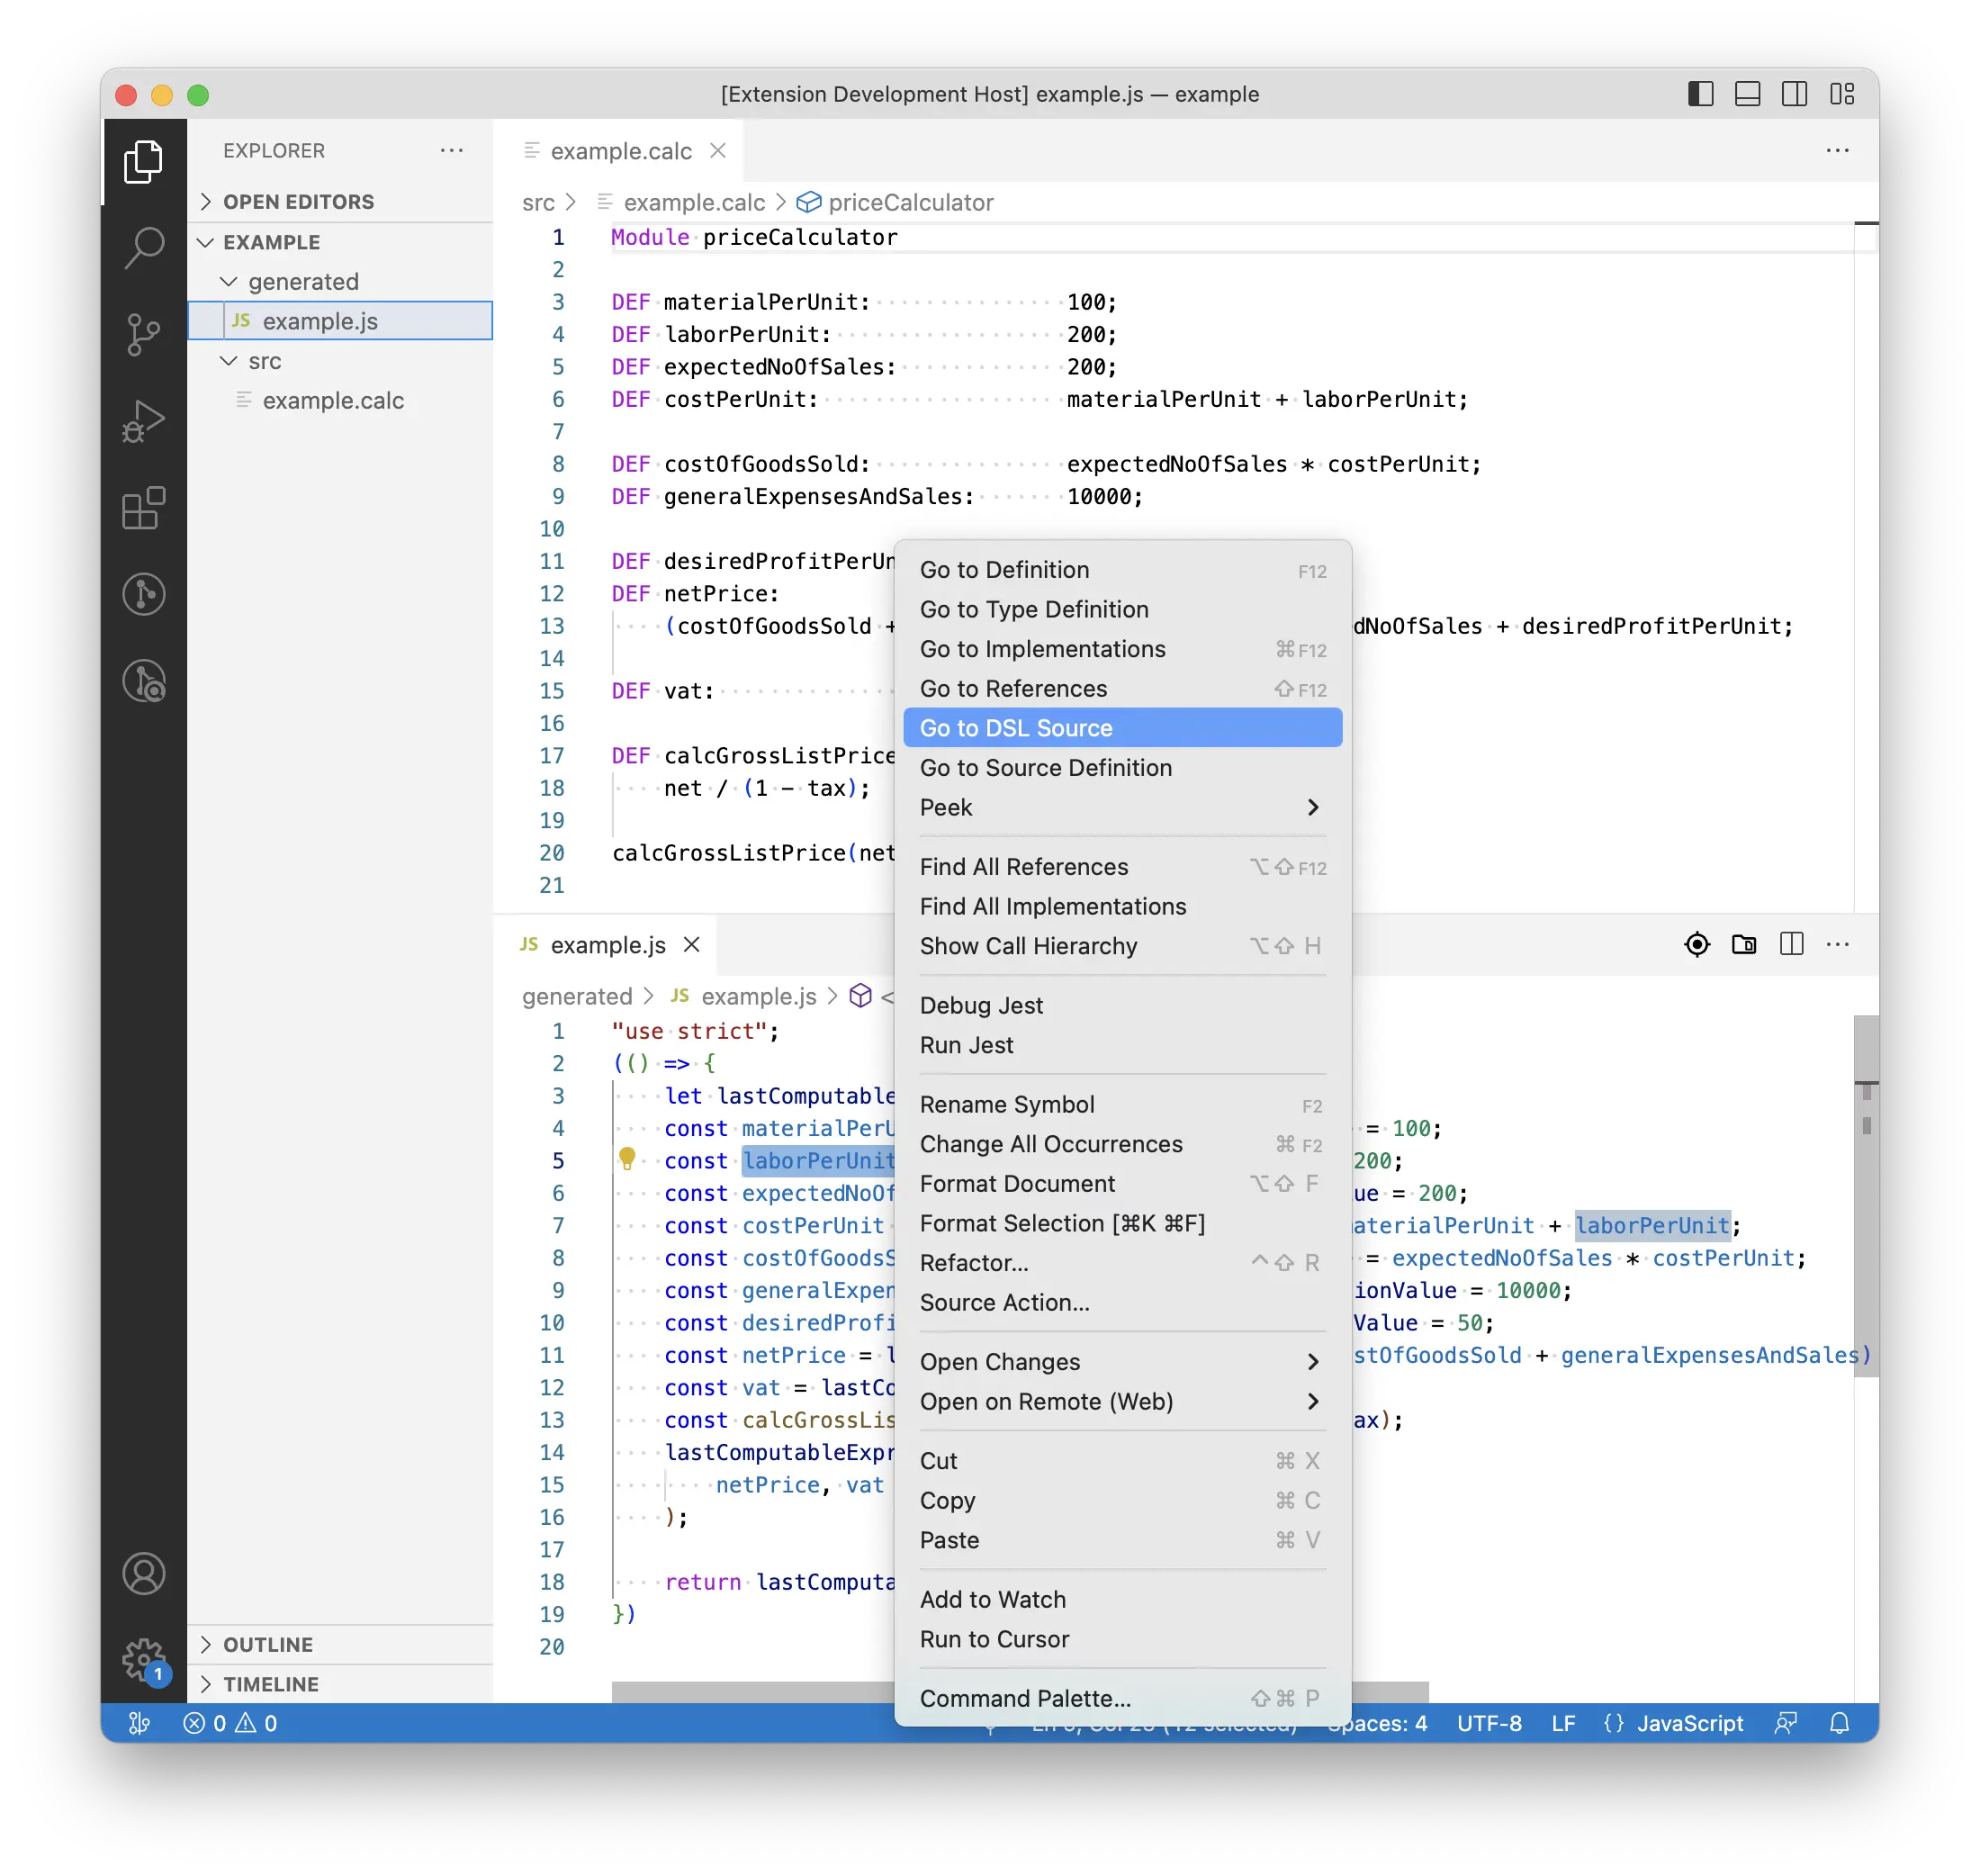
On the other hand users might want or need to investigate why the generator has put certain statements into the generated artifacts, i.e., because of which definitions in the source. Having the opportunity to ask the dev tool to tell what is the cause or source of a certain statement in the generated code – as shown in the second screenshot – will probably simplify such tasks.
In addition to such kinds of static code analyses I would love to run the generated code, put a break point at some entry point, and step through the implementation by stepping through the source code written in the DSL, as shown in the third screenshot.
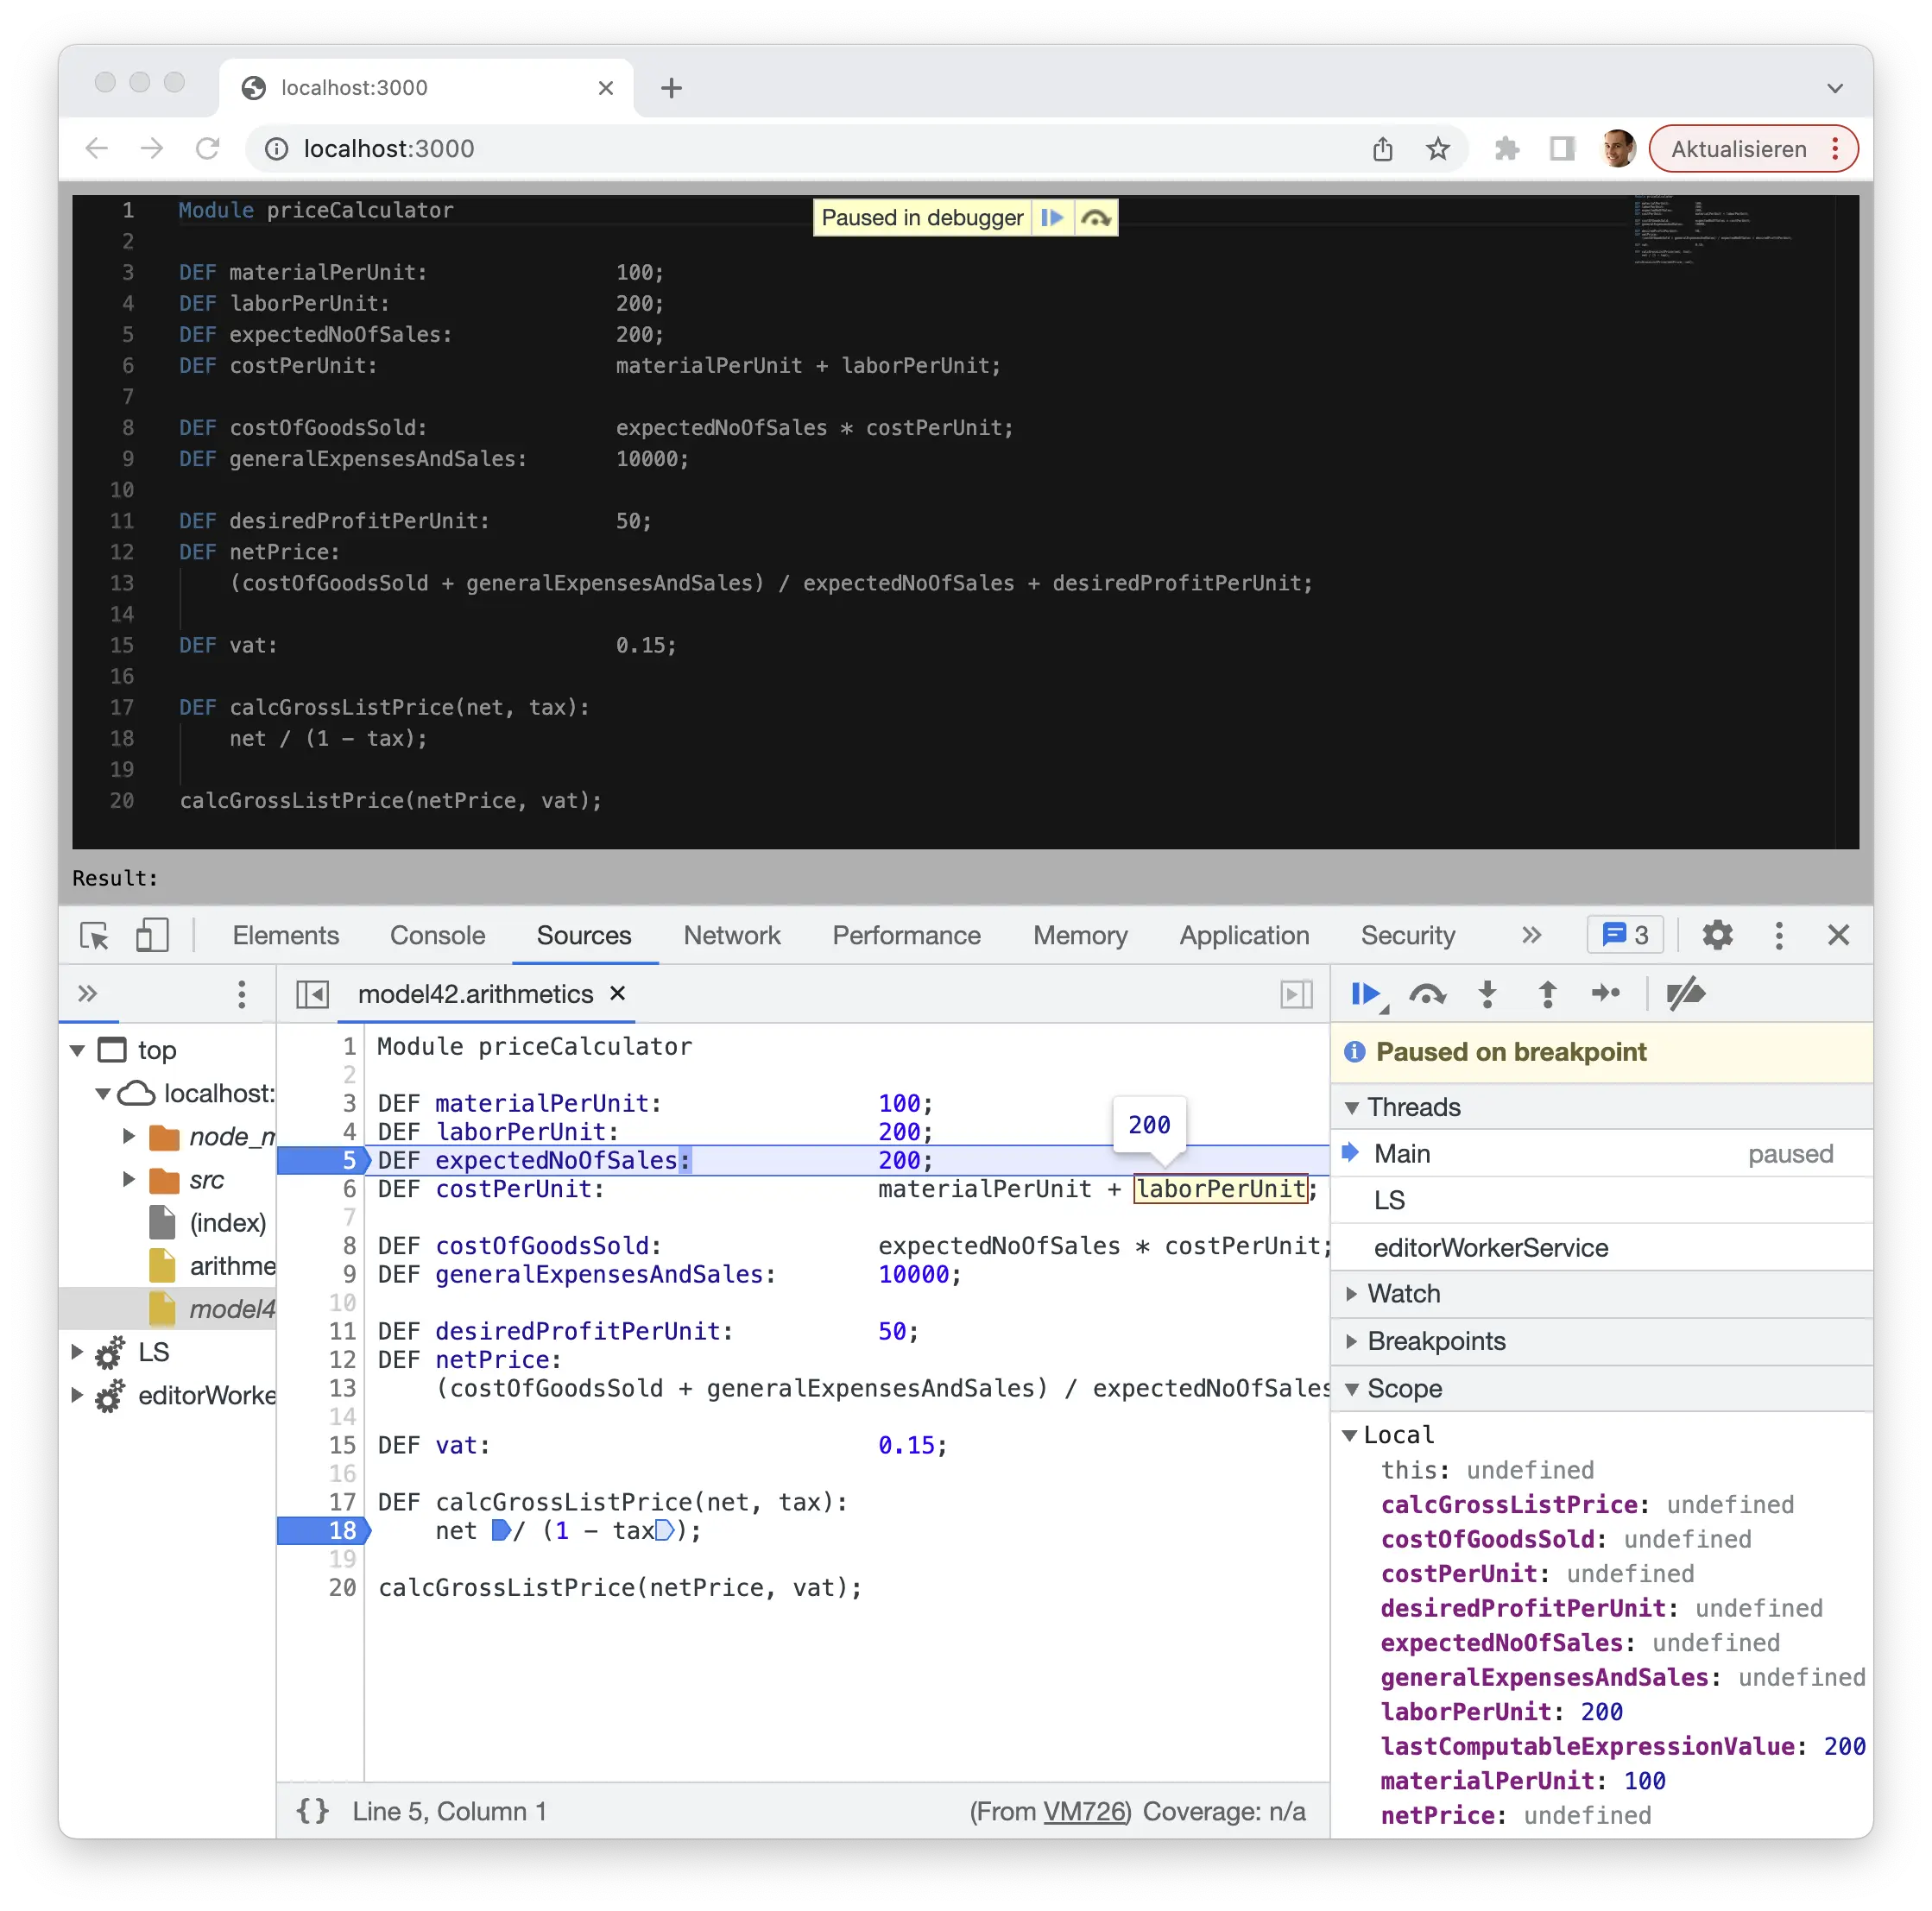
Here a Monaco editor equipped with Langium’s Arithmetics example language is added to a plain website, and populated with our running example script introduced in part one of the series. The Langium-based language server has processed the input, determined that there are no validation errors, and called the generator. The obtained JavaScript code, along with corresponding source maps, is then evaluated. The source maps have been created based on tracing data that was captured during the JavaScript code generation process.
Capturing tracing data
In order to implement the features described above, we need to capture tracing data associating relevant regions of text in the source data with corresponding regions of text in the generated artifacts. Here, we assume the source data being formulated in human readable text - typically according to some DSL - and persisted in files on disc (at least associated with some URI), while the generated artifacts are just assumed to consist of a stream of characters.
Recall from part two of this series that we separated the code generation task into two: (1) the composition of a generation description, and (2) the rendering of the description into the desired text. I introduced a tree-shaped data structure for capturing the description, consisting of a few different data types that are subsumed by the union type GeneratorNode. Now that we have introduced such a dedicated data structure, we can augment those data with additional information as we like. Recall also from last time the template tag function expandToNode, which builds up instances of GeneratorNode for given JavaScript template literals during task (1), and also the generator function generateModuleContent3(Module):
function generateModuleContent3(module: Module): Generated {
    return expandToNode`
        let ${lastComputableExpressionValueVarName};
        ${ joinToNode(module.statements, generateStatement, { appendNewLineIfNotEmpty: true }) }

        return ${lastComputableExpressionValueVarName};
    `;
}
The contained template contributes static code that is generated regardless of which statements are defined within the provided module, and the generated output representing the statements contained by module. The generation of those statements is done by the function generateStatement(Statement), which is provided to the call of joinToNode(...) in line 4.
Hence, the content of the template lines 3, 5, and 6 can only be associated with module, as that is the cause of their addition to the output. In contrast, the output produced by generateStatement(Statement) can be associated with module as the statements are contained in module, but more specifically they should be associated with the corresponding instance of Statement being contained in module.statements. To achieve both, Langium offers the functions
expandTracedToNode<T extends AstNode>(T, Properties<T>?, number?)joinTracedToNode<T extends AstNode>(T, Properties<T>?).
We can use these functions to capture the desired tracing data and rewrite generateModuleContent3 as follows:
function generateModuleContent4(module: Module): Generated {
    return expandTracedToNode(module)`
        let ${lastComputableExpressionValueVarName};
        ${ joinTracedToNode(module, 'statements')(module.statements, generateStatement, { appendNewLineIfNotEmpty: true }) }

        return ${lastComputableExpressionValueVarName};
    `;
}
Observe that both functions return functions again. The returned functions’ signatures exactly match the signatures of expandToNode and joinToNode. Hence, the result of expandTracedToNode(module) is a tag function that converts a template literal into a tagged template. Internally it delegates to expandToNode, and in addition annotates the composed GeneratorNode with information of module being the corresponding source object.
The same principle applies to joinTracedToNode(module, 'statements'). It returns a function with an interface equal to that of joinToNode(...). The invocation in line 4 of generateModuleContent4(Module) means:
Apply generateStatement(Statement) to each element of module.statements, annotate each resulting GeneratorNode with tracing information saying this generated part represents the i th element of the (collection) property named ‘statements’ of parent object module, add all these generator nodes to a container GeneratorNode, and annotate that one with information saying this generated part represents the entire content of property ‘statements’ of the source object module.
Anatomy of tracing data
Langium does the evaluation and computation of the tracing data as part of the generation task (2). Precisely, the function toStringAndTrace(GeneratorNode) does that, it replaces Langium’s toString(unknown) in that case. It returns an object of the shape { text: string, trace: TraceRegion }, with text being the desired generated text and trace being a composite structure describing the nested trace region associating regions within the generated text to regions within the source documents. The data type TraceRegion is defined as follows:
interface TraceRegion {
    sourceRegion?: TextRegion;
    targetRegion: TextRegion;
    children?: TraceRegion[];
}

interface TextRegion {
    fileURI?: string;
    offset: number;
    end: number;
    length?: number;
    range?: Range;
}
Assuming that the source data are valid AST elements created by Langium by parsing some text formulated in a DSL syntax, those instances of AstNode are annotated with objects representing the corresponding concrete syntax nodes. The latter in turn provide start and end positions within their DSL documents as well as the documents’ file URIs. By means of those information toStringAndTrace(GeneratorNode) calculates the source region of a GeneratorNode. The corresponding target region is computed during the text rendering process by logging the start and end positions of the generator nodes’ resulting text. At that, the fileURI property of a target TextRegion will never be set, as it is unknown at that point in time whether the resulting text will be written to some file, and, if yes, what the file’s URI might be.
Let us consider the following reduced example input and corresponding output:
Module priceCalculator

DEF materialPerUnit:               100;
DEF laborPerUnit:                  200;
let lastComputableExpressionValue;
const materialPerUnit = lastComputableExpressionValue = 100;
const laborPerUnit = lastComputableExpressionValue = 200;

return lastComputableExpressionValue;
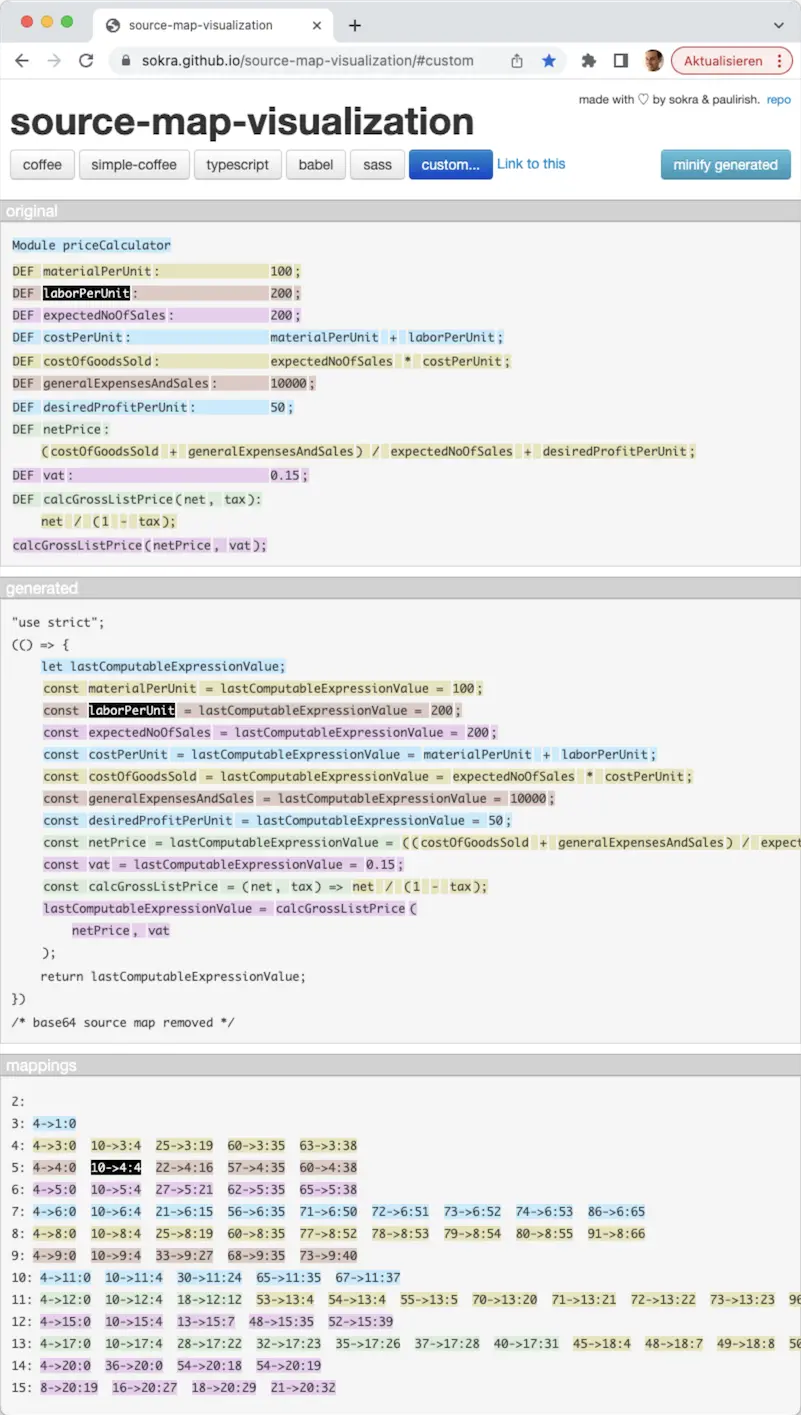
I illustrated the resulting trace regions in the following screenshot:
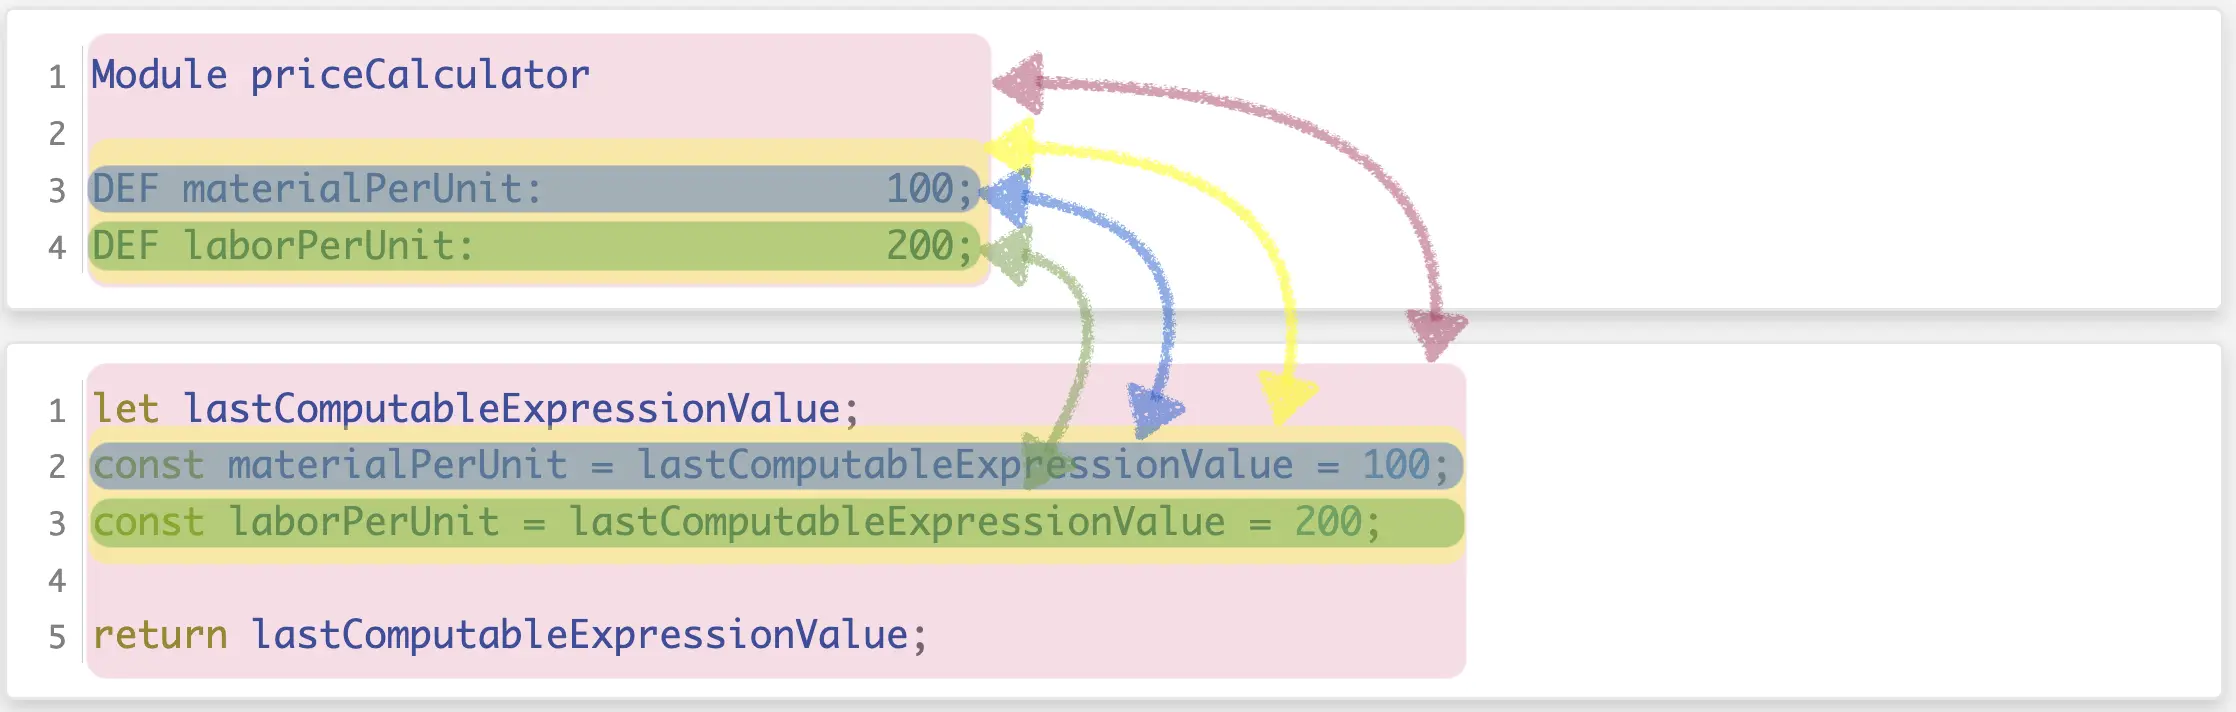
The areas limited by the rose background color here represent the root trace region being described by trace, which is derived from the generator node returned by generateModuleContent4(module). The areas indicated by the yellow-ish rectangles represent the regions derived from the generator node produced by the call of joinTracedToNode(...)(...) in line 4 of generateModuleContent4(Module). The source region is equal to the “bounding box” of the definitions of all elements in property 'statements' of object module, the target region is equal to the “bounding box” of all text snippets described by the results of the calls of generateStatement(Statement) performed by joinTracedToNode(...)(...) in line 4 plus the inserted line separators required by { appendNewLineIfNotEmpty: true }. The instance of TraceRegion containing the descriptions of these source and target text regions is accessible via the root trace object’s children property, i.e., trace.children[0].
The areas of blue-ish background denote the trace region consisting of the source text area involved in the definition of entry 0 of property 'statements' of object module and the target area being described by the generator node returned by the execution of generateStatement(module.statements[0]), correspondingly. The trace region description object is accessible via trace.children[0].children[0]. The same applies to the areas of green-ish background except that they denote definition and generated text of entry 1 of module.statements. That trace region description is accessible via trace.children[0].children[1].
In practice, this depth of tracing data capturing would not be the end. If we would continue applying expandTracedToNode(...) to all the particular cases to be distinguished within generateStatement(Module), we would get fully deeply resolved and fine-grained trace regions down to each identifier, operator, and number literal.
Converting tracing data to JavaScript source maps
Today’s browsers as well as VS Code support the concept of source maps to facilitate the debugging of code that has been compiled, transpiled, or minified. Source maps may be attached to productive JavaScript code as separate files, or even inlined into the production code (which usually will blow up the code to be transmitted significantly). Consequently, in order to achieve the goal of being able to debug scripts written in the Arithmetics DSL, we need to not only capture tracing information, but use them to synthesize data adhering to the source map format. The good news: We don’t need to do this entirely ourselves. The package source-map published on https://npmjs.com does most of the work for us.
In the langium-in-browser-codegen-example GitHub repository, I have implemented a composition of source map data and their inline attachment to the generated JavaScript code. If inlined the source map data must be base64 encoded – which means that we basically have no chance to review what we actually generated. However, sokra and some further good souls have build the tool https://sokra.github.io/source-map-visualization/. It allows us to upload the generated code including the source map data (or plus the source map data as separate files, alternatively). Below, I added a screenshot of the provided visualization. The original page even allows to interactively review the source and target regions by hovering over some region and observing the highlighting of its counterparts, if available. Wonderful! 🤩🙏
Show time!
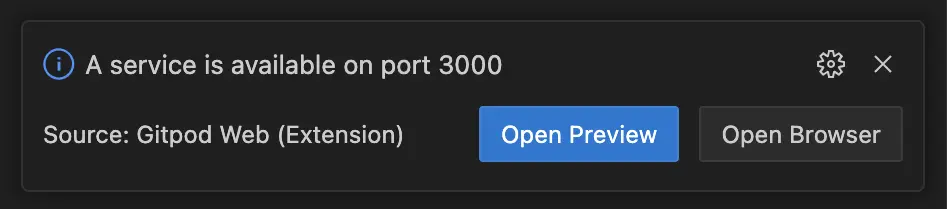
Clone https://github.com/langium/langium-in-browser-codegen-example/ locally, or open it in Gitpod. Gitpod will prepare everything for you, and you can directly open the demo page in ‘Browser’ as offered by the following dialog
Otherwise, execute npm install and npm run serve. The latter command will spawn a local web server serving the demo page with the editor as shown above.
Open that page by visiting http://localhost:3000 in your browser.
Feel free to play with the language and do some changes in the script, and observe the displayed result value at the bottom left corner.
Then open the browser’s developer tools → Sources → Open file (Ctrl/Cmd + P) index.ts (from 3000-langium-langiuminbrowse-.../src/arithmeticsEditor / localhost:3000/src/arithmeticsEditor) and add a breakpoint at line 45. Do another change in the editor, and once the breakpoint is hit, hit step into several times until you see the script in the Arithmetics DSL. 🥳
Don’t forget to continue stepping!
I also created a short screen cast showing expected behavior:
Let me add a few words on the architecture of this solution.
The website shown by the browser contains a Monaco editor widget that is connected with a Langium-based language server according to the Language Server Protocol proposed by Microsoft™️. The language server is running within a web worker and sends a notification to the language client (the editor) once a change to the input was reported to and processed by the language server.
As opposed to typical setups, here the language server sends a serialized snapshot of the parsed AST back to the client as part of the aforementioned notification. This snapshot is enriched with text region information. The code generation is then performed on the main thread, mainly for demonstration purposes. This way you can easily step through the generation and seamlessly continue stepping through the execution of the generated result. The generator implementation used here first revives the AST, then generates the JavaScript code along with capturing the tracing data, and finally derives the source map information and attaches it to the generated code.
Wrap up
In this post I discussed aspects of working with generated code that go beyond the actual process of generating code. I proposed some features that have the potential to significantly enhance the value of a language tool. Building such features involve the recording of tracing data during the code generation process. I here presented selected parts of Langium’s code generation API that do this job.
The tracing data is captured in a use-case-agnostic manner. In order make the output of our code generator debuggable I added an implementation converting the tracing data into JavaScript source maps. Those roughly 50 line of Typescript code are not bound to Langium’s Arithmetics example DSL, but can be used in any other DSL-based code generator with JavaScript as target language.
À propos target language
Although I’ve been using an example of generating JavaScript code from a DSL-based input throughout this blog post series, the principles and solutions discussed here apply to any target syntax that is human-readable. Imagine target languages like C++, C#, Java, Rust, SQL, or dialects of CSV, JSON, XML, YAML to name just a few, or any fully-custom syntax. The issue of having nicely formatted code templates vs. having properly formatted generator output – the whitespace problem – applies to any target language or format. The same is true for the question of skipping or keeping empty lines in the generation result.
In contrast, the debugging use case enabled by recording tracing data is quite special, but still it is not unique to JavaScript: Former colleagues of mine added instrumentation of Java binaries (class files) to the Xtend tooling they built based on the Eclipse platform. Other languages/compilers/runtimes might enable similar opportunities in future.
That’s it about Code Generation for Langium-based DSLs. 🏁
If there’re any questions left you’re always welcome to leave feedback at Langium’s discussion board. Happy generating. 🤓
About the Author
Christian Schneider
Christian is a seasoned DSL enthusiast with a decade of expertise in language tooling and graphical visualizations. While striving for innovative and sustainable solutions, he still pays attention to details. Quite often you’ll find Christian nearby the sea, with the seagulls providing a pleasant ambience to his meetings.